Posts
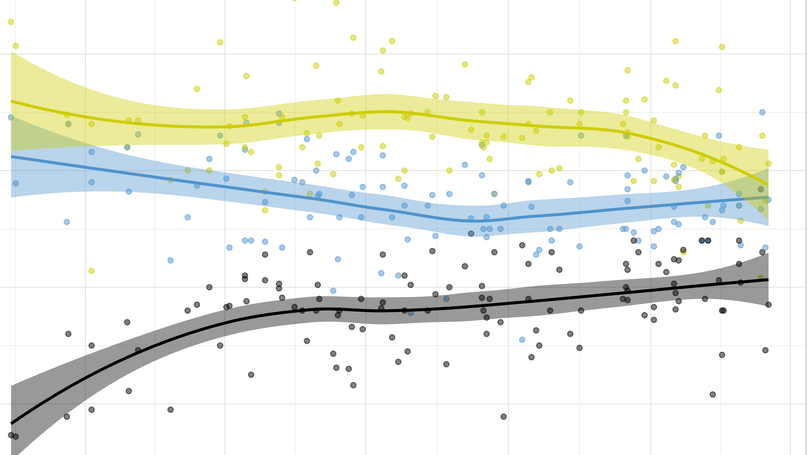
Hace un par de semanas, dando vueltas por internet, me encontré con el Observatorio de Encuestas de La Política Online. Me pareció una buena idea. Es un producto que es muy frecuente en años electorales en Estados Unidos: un agregador de encuestas electorales, que te muestra algunos simples promedios móviles de la intención de voto de cada partido, algunas líneas de tendencia y, cuando quieren arriesgar un poco, proyecciones o estimaciones de lo que consideran más probable que pase finalmente en la elección, como las famosas agujas del New York Times o los porcentajes de probabilidad de FiveThirtyEight.
Animations are becoming a popular way to plot data, as they allow to increase the dimensionality of a graph. If static graphs can plot data along spatial dimensions (the axis, size of geometries) or along visual dimensions (colors, shapes), animations allow for one more: some variation can be shown with the changes across different frames.
In this post, that I will update regularly as I come across new resources, I will drop a list of useful material to learn R, for beginners and not-so-beginners. Some of the references will be particularly focused on R for social/political scientists, while others are tailored for general interest R users.
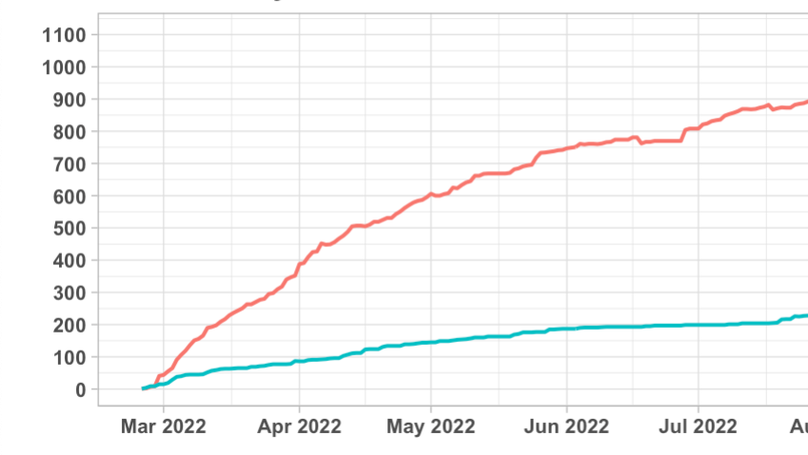
In office hours, some students wanted to use data from the war in Ukraine for a problem set, so we looked at an interesting source. The Oryx Project uses open source information, like pictures and videos on social media, to rigorously document equipment losses in various conflicts.
